Interest Rate Effects
Liquidity Effect | IR affects RBA and bank transactions |
Income Effect | Increase in interest rates lowers spending (greater cost of borrowing, greater benefit of saving) |
Inflation Effect | Increase in interest rates raises the prices of goods |
Fractional Banking and Money Creation

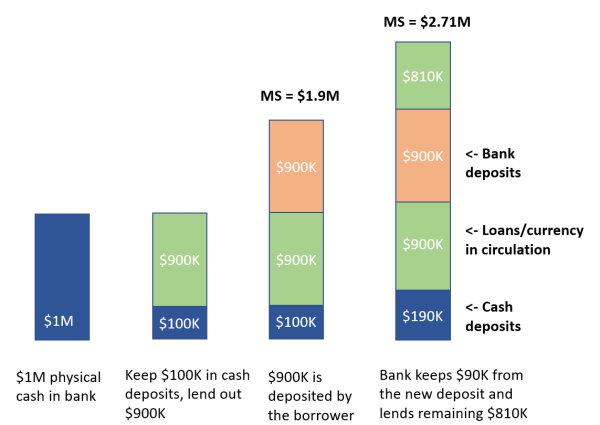
- $1M in physical cash in bank
- Assume a 10% reserve-deposit ratio, so keep 10% or 100K reserves to meet withdrawals.
- Lend out 900K. That 900K is deposited. Money supply has increased to 1.9K. MS = currency in circulation (900K) + bank deposits (100K + 900K). Inflation has increased as price of goods increases (more D)
In effect, the loans/supply of money to the market are creating more money supply.
Velocity = value of transactions/money supply
The Role of Central Banks
- Act as a bank to commercial banks (i.e. banks can deposit with CB)
- Intermediary to allow banks to lend to and borrow from each other
- E.g. in Australia, RBA targets a cash rate (nominal) by issuing bonds (asks for loans) or buying bonds (increases cash in circulation) to affect money supply
- This is how RBA sets cash rate (through D & S of money). Cash rate is rate at which banks can borrow from CB.

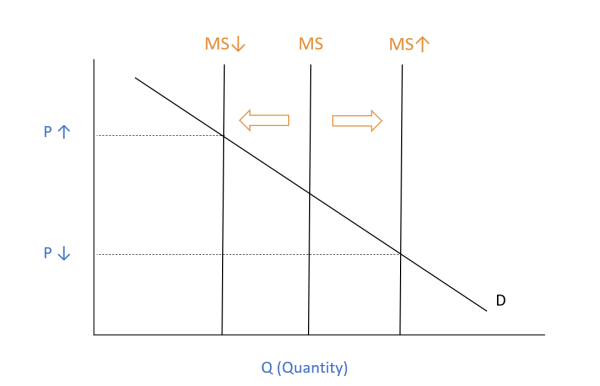
Long-run money supply is perfectly inelastic – no matter how demand and prices change, the CB provides the same amount of money into circulation.
The market for loanable funds reflects the interest rates set by banks to consumers.
Bonds
Bond: Loan which can be trade
Can be government- or corporate-issued
Primary Market | Face value: purchase price, to be repaid at maturity Coupon rate = fixed interest payment to maturity |
Secondary Market | Market value: amount at which bond is currently traded
|
Yield
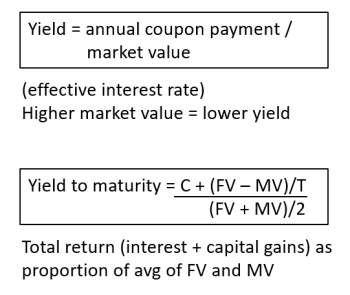
Yield refers to return on investment (interest only or interest and capital gains).
There are two rates of return which are talked about when it comes to yields:

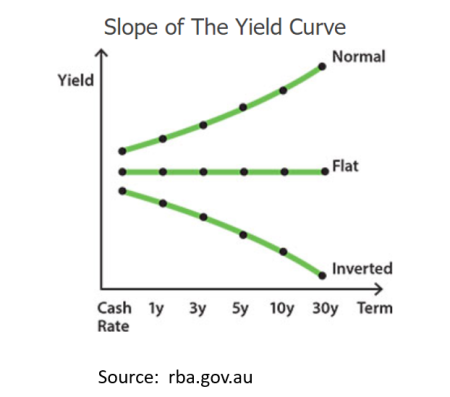
The Yield Curve shows the yield on identical bonds with different terms to maturity.
Liquidity Premium Theory states that investors prefer shorter-term, liquid bonds. Therefore there is an upwards bias built into long-term bonds, as investors need to be compensated for holding them in the long-term.

The bond yield curve plots the yield for various bond terms.
The yield is determined by:
- cash rate, which influences the level (y-intercept) of the curve
- difference between yields on short-term and long-term bonds, shown as the slope
- Normal yield curve: indicates expectations of higher interest rates in the future. It is observed during times of economic expansion and inflation
- Flat yield curve: similar yields on short and long-term bonds. May indicate stable economy or transition between normal and inverted curves
- Inverted yield curve: future expectations of economic contraction, as the CB reduces rates when growth and inflation are low
|
Expectations Theory |
Provides that future short-term rates can be determined by current long-term rates. |
|
Market Segmentation Theory |
Different markets exist for short and long term securities as they are not substitutes – different investors prefer different maturities. Therefore, short and long-term rates are unrelated. |
|
Liquidity Premium Theory |
Investors prefer short-term instruments so a premium must be offered on longer-term instruments. |
