
Investing
Investing in Stock/Share Markets
- Market
- Securities Trading System
- Clearing and Settlements
- Regulation
Investing vs Trading
Investing: Purchasing and holding financial assets for the long-term, to benefit from growth.
Trading: Frequent buying and selling to make profits. Trading is also good for investors as it increases overall liquidity in market and increases likelihood you will find a counterparty.
Types of Markets
Dealer – OTC, market-maker: Dealer acts as counterparty for buyer and seller and quotes bid-ask prices.
Common in bond and currency markets.
Most liquid type of market
Broker: finds counterparty for buyers and sellers
Common for IPOs
Exchange-traded: Automated broking, trades executed based on order books.
Investment Strategies
Approaches | |
Value | Investing in established companies that have been profitable over a period of time and offer dividends |
Growth | Investing in companies that show potential for future growth |
Direct Investment | |
Buying and selling stocks | Purchase of individual stocks |
Indirect Investment | |
Active | Fund manager actively picks stocks (e.g. REITs) |
Passive | Fund which tracks and index (e.g. ETFs) |
Fundamental and Technical Analysis
Fundamental Analysis – what to buyFinding a stock’s intrinsic value | |
Qualitative |
|
Quantitative |
|
Technical Analysis – when to buy | |
Approach | Use of asset-specific price and trading activity such as charts |
Uses | Used by day traders (short-term) |
Fundamental Investment Analysis
Approaches
Time-series Analysis | Comparison of a firm with itself over a period of time |
Cross-sectional Analysis | Looking at different companies within an industry at different points in time |
Benchmark | Comparison against industry norms |
Techniques
Comparative Analysis | Comparison of financial statements of a company to identify trends |
Common Size Analysis | Analysis of items within financial statements -Income Statement items are reported as % of revenue -Balance Sheet items are reported as % of assets |
Ratio Analysis | Ratio of two or more items on financial statements |
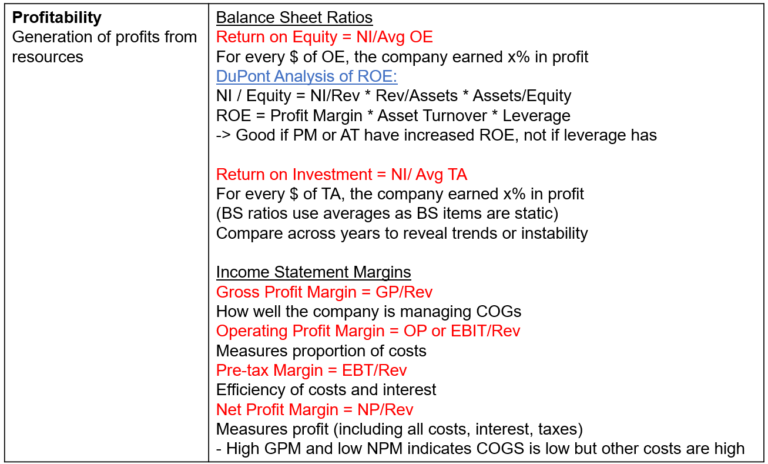
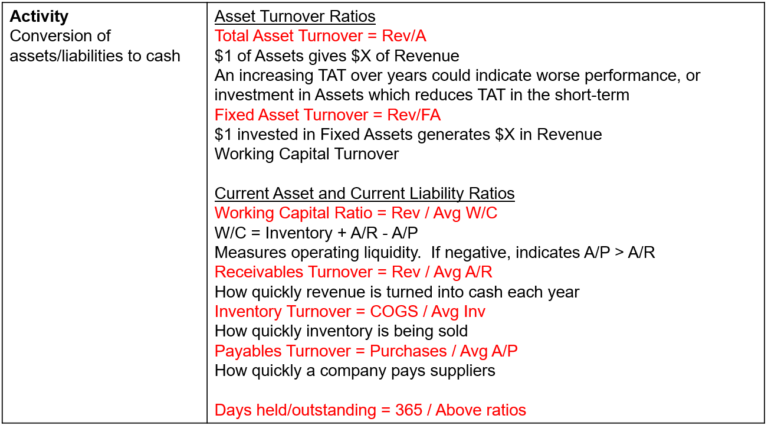
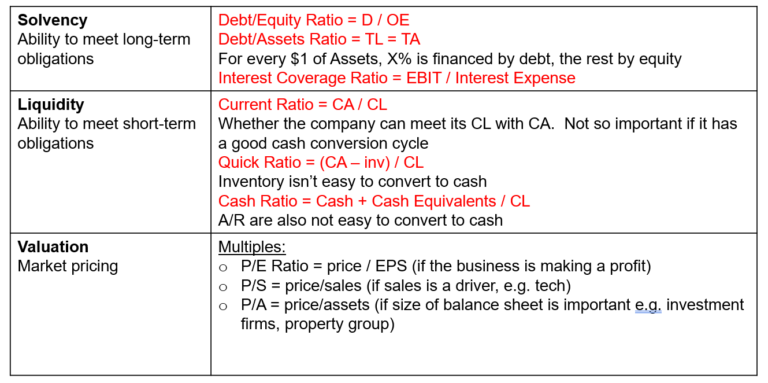
Financial Analysis Ratios
Managed Products
Exchange-traded Funds (ETFs) | Diversified portfolio of shares |
Real Estate Investment Trusts (REITs) | Diversified interest in real estate |
Infrastructure Funds | Diversified interest in infrastructure projects |
Derivatives and CFDs | Derive value from underlying asset, some highly leveraged |
Risk and Return
Risk and return are major considerations in the investment decision.
Return is measured by expected value – the outcomes weighted by their probabilities, and the risk is measured by standard deviation – the distribution of returns from their mean.
Return
Return = Income (dividend) + capital gains
Rate of Return = Return / Purchase price
Expected Return
However, we don’t know future payoffs, so look at Expected Return, based on probability of payoffs
Expected Value = Outcome x Probability
EV = P(A(%)) * Outcome A + P(B)[100%-P(A)]
Risk
Variance – Distance from mean squared
Var = x – [mean of x]
Standard Deviation – Squareroot of Variance, or avg distance from mean
SD = √ Var
Portfolio diversification
Good performing assets offset badly-performing ones.
Generally, high risk leads to high returns, but not for risk due to non-diversification.
Diversify through:
- asset class – fixed income, shares, alternate
- size – small, mid or large cap
- industry
- defensive/growth assets
Systematic risk | Relating to whole market or economy – cannot be reduced through portfolio diversification (“beta”). |
Unsystematic risk / | Relating to specific share/company – asset-specific risks, which can be reduced through portfolio diversification, up to a point (also known as “alpha”). |
Asymmetric bet: upside is very different to downside
Standard and Alternative Investments
Standard Investments | Alternative Investments |
|
|
Derivatives
Definition – Financial instrument whose value is derived from an underlying asset Purpose – to manage risks of price fluctuations Example – Farmer locks in price of wheat sale now to protect against risk of currency downturn. Underlying asset (wheat) is sold and physically delivered separately Uses – Hedging and speculation | |
Exchange-traded | Standardised and traded on an exchange |
Over-the-counter | Non-standardised and negotiated and traded directly between buyer and seller |
Types of Derivatives | |
Future | Agreement to buy physical asset (commodity, energy or metals) at future date for specified price. Exchange-traded. Forward – OTC (direct between parties) |
Option | Right to buy or sell commodity at future date for specified price Buy – call (spot price > strike price) i.e. buy at strike price Sell – put (spot price < strike price) In-the-money: Exercised within the above rules Out-of-the-money: The rules are not met, so option is useless Covered: satisfaction of option is guaranteed Naked: no guarantee it will be completed |
Swap | Agreement to exchange cash flows from underlying assets |
CFD | Contract-for-difference: Exchange of the difference in value of underlying asset between contract open and close dates |
Hedging using derivatives involves entering into two contracts:
- Contract to buy or sell the underlying asset
- Contract for futures
Derivatives Trading
Margin Requirements | Trading platforms require a percentage of the sale price to be posted in advance to make sure buyers and sellers can wear losses |
Long Position | Investor owns the asset – expecting its value to rise (bull market) |
Short Position | Investor sells an asset which it has borrowed – buy later at a lower expected price (bear market) |
Call | Option to buy |
Put | Option to sell |
Open Position | A trade that has not been closed |
Closing out a contract | Reverse the contract by entering into opposite position – e.g. sell long position or buy asset in short position |
Objectives/Strategies | Hedge – reduce risk in price fluctuations Speculate/Trade – aim to make profit from price fluctuations (instead of capital gains e.g. shares) Arbitrage – take advantage of price differentials |
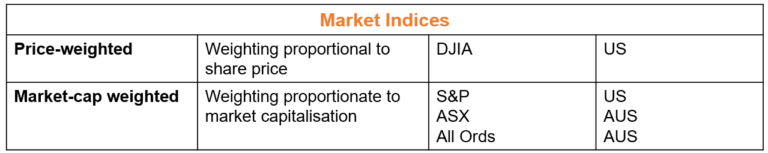
Indicies
Efficient Markets Hypothesis
Stock/share prices reflect all available information. They trade at their fair value – are not under- or over-valued. Therefore, there can be no arbitrage and investors cannot outperform the market in the long-term. | |
Strong Form | Public and private (insider) info is reflected in stock prices |
Semi-strong Form | Historical and current public info is reflected in prices (current/new info is quickly assimilated) |
Weak Form | Only historical public info is reflected in prices |
Implementation
Bid-Ask Prices
Bid Price | Maximum an investor is willing to pay (below market price) |
Ask Price | Minimum a seller is willing to accept (above market price) |
Spread | Difference between bid and ask prices |
Types of Orders
Market Order | Order to transact immediately, at or around market price. |
Limit Order | Order above or below a specific price. Once the price is reached, it becomes a market order.
|
Order Book

Spread | Ask – Bid |
Price Impact of Order | Fulfilment of orders changes the best ask/bid prices |
Order Aggression | Closer to best price |
Partial Fulfilment | Order may be partially filled if not all shares can be matched |
Dollar cost averaging: spreading investment out rather than investing as a lump sum, to reduce risk of investing at the wrong time.
However, it doesn’t work well if the market price is rising – the average cost will increase.
It can also lead to a lot of brokerage fees being incurred.
Dividends
Frequency | Usually half-yearly (interim dividend) and yearly (final dividend) |
Ex dividend Date | 4 days prior to Record Date – only shares purchased before this date are eligible to receive dividend, otherwise later purchase share “cum dividend” |
Record Date | Date the company closes share register to assess eligibility for dividend (i.e. registration paperwork must be finalised) |
Price Implications | Usually share price increases prior to ex dividend date, then reduces by amount of dividend |
Short-selling
|
Long |
Buy shares and place stop-loss order |
|
Short |
Sell shares and place stop-loss or market order |
|
Trigger price |
Price at which stop-loss or market order is triggered, execution price may be different |
Liquidity
Immediacy | |
Width | |
Depth | Number of shares that buyers and sellers are willing to trade at each price. |
Resiliency |
Transaction Costs
Explicit | Brokerage fees, taxes |
Implicit | Spread, opportunity cost |
Monitoring
|
Benchmarking |
Use indexes to benchmark your investments (compare performance over the same period) |
|
Rebalancing |
Make changes if the asset allocation has changed over time |
info@businessintegrals.com
© All Rights Reserved 2022