Liquidity
Cash flow management
Investment
Whether and when to invest in which assets
Financing
Structure of funds – debt/equity
Profit distribution
Dividends
Liquidity/working K management
Monitoring of current asset and current liability ratios to ensure sufficient cash flow
K investment – budgeting
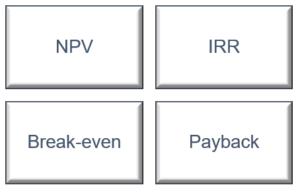
Investment Decision
Invest if NPV > 0 i.e. projected earnings > costs i.e. profitable
Today’s value of future cash flows – today’s outlay
Financing – K structure and funding of investment
Financing Decision
Debt or equity
D/E ratio
Gearing: Debt/assets
Dividends or retain profits
Based on dividend policy (retain earnings or provide dividends, what amount and frequency)
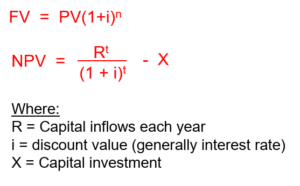
NPV: Difference between discounted capital inflows and outflows. Future value is discounted for risk and time value of money.
Time Value of Money: A dollar today is worth more than a dollar tomorrow due to the returns you can earn on it over time.
PV: present value of net future cash flows. The profit a project generates in today’s dollars.Net: Difference between capital inflows and outflows.
Even if one project has greater returns, another may have a higher NPV if the returns are generated sooner. Invest if NPV > 0
Excel formula:
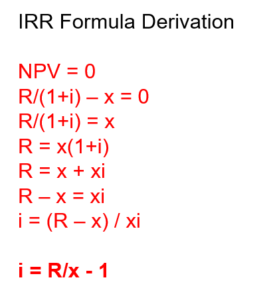
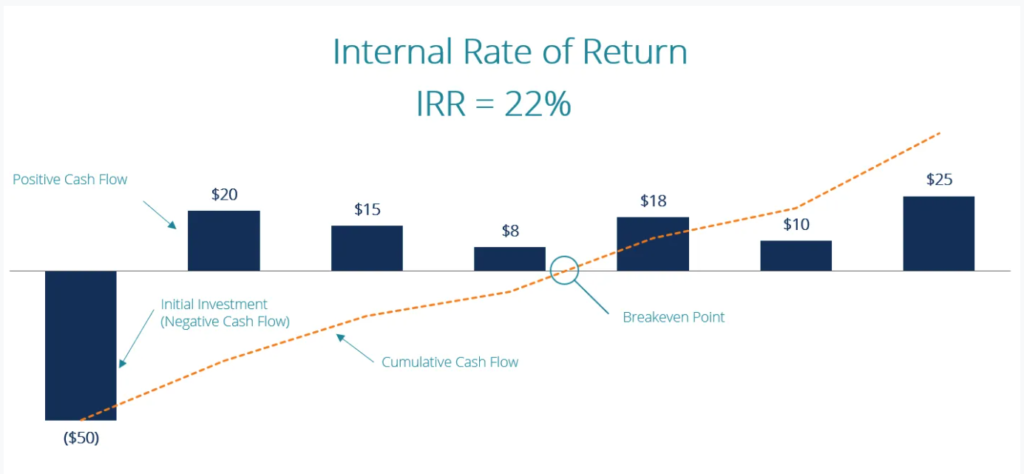
IRR is the required discount rate/ rate of return that causes NPV = 0.
Compare this with a company’s target rate / minimum acceptable rate of return and IRR of projects with same duration.
The break even point is:
The payback period is the time taken to recover the investment / reach the break even point i.e. pay back the cost.
BCR: Benefit Cost Ratio
Accounting Rate of Return (ROI)Profit / Investment No DCF
The analysis of return (e.g. breakeven) is multiplied by the variance level (e.g. +- 15%) on both sides, to give worst, base and best case outcomes.
Higher debt/equity ratio indicates insolvency riskHowever, if returns/earnings > Debt repayments, earnings will benefit from the debt.
info@businessintegrals.com
© All Rights Reserved 2022